One of the holy grails of COPD research is being able to identify “rapid progressors”, i.e. individuals who are destined for rapid loss of lung function. One of the challenges in doing this in COPD is that the rate of disease progression is usually slow, so that it (probably) takes years of observation to distinguish a “rapid progressor” from a “nonprogressor.”
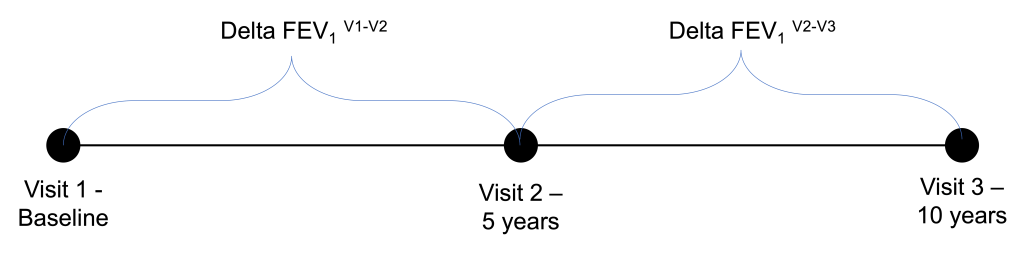
In the COPDGene Study, our spirometric datapoints come at 5-year follow-up intervals. After the COPDGene 5-year study visit, there was great interest in being able to identify “rapid progressors” who could be studied intensively at the 10-year visit. At first glance, it might seem natural to look for rapid progressors in the set of individuals who had the greatest lung function decline between visit 1 and visit 2; however as I show below this approach can backfire pretty badly, and it’s a nice illustration of both regression to the mean and the practical importance of measurement error. The three COPDGene study visits are shown below. When we built the prediction model we were at the 5-year time point using the visit 1 and 2 data to try and predict behavior at visit 3. Now, we have roughly have of the visit 3 data available to us, so we can learn some things about how successful we were at prognosticating from the five-year visit.
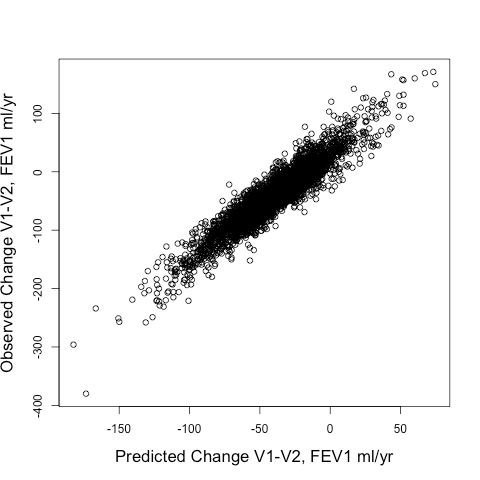
When we tried out different ways to identify rapid progressors, we compared two approaches: 1) Defining rapid progressors based on the observed change in FEV1 from Visit 1 to Visit 2 (observed delta FEV1V1-V2) or 2) Defining rapid progressors based on the predicted change in FEV1 (predicted delta FEV1V1-V2) using the output of a random forests model using a standard set of clinical and radiographic predictors. The model’s fit to the observed delta FEV1V1-V2 was pretty good. The scatterplot is shown below, and the model explained 87% of the variance of the observed delta FEV1V1-V2.
The real question though is how well the model predicted future change in lung function, i.e. the FEV1 change from V2-V3 (observed delta FEV1V2-V3). Here is the correlation of the observed delta FEV1V2-V3 to predicted delta FEV1V2-V3 obtained by using V2 values of the predictor variables entered into the same prediction model as described above. This model explains 10% of the variance of observed delta FEV1V2-V3.

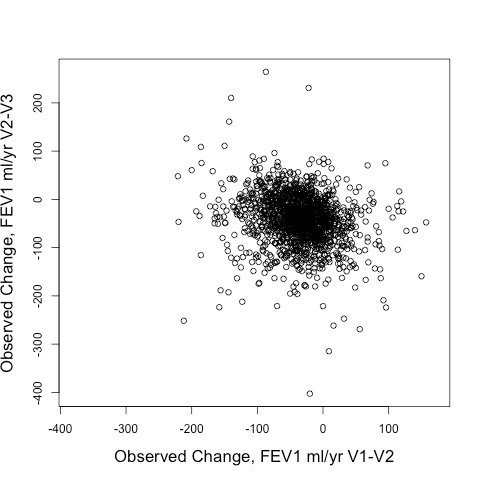
Not great. But interestingly so much better than using the observed delta FEV1V1-V2 to predict the observed delta FEV1V2-V3. Take a look at the correlation between those two below. It’s negative! In other words, if you want to find rapid V2-V3 progressors, you’d be better off selecting SLOW V1-V2 progressors than you would be selecting rapid V1-V2 progressors.
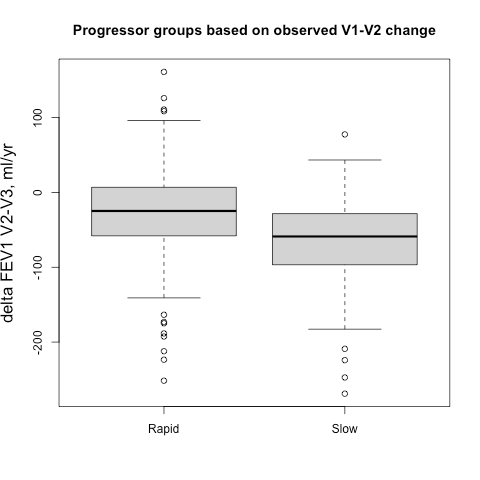
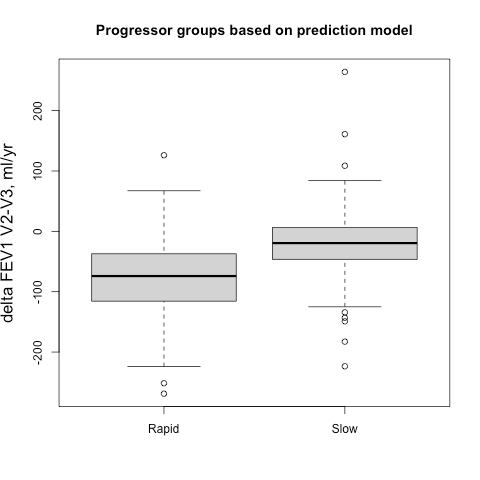
Sometimes it easier to see this when subjects are broken into groups, so we identified groups of 500 fast and slow progressors (stratified by gender to account for differences in lung size) according the their observed delta FEV1V1-V2 and their predicted delta FEV1V1-V2, and then we compared the prospective 5-year progression of these groups (observed delta FEV1V2-V3). These results are shown side-by-side below. It’s apparent that for the groups defined by observed change you actually get the opposite of what you want. The slow group progresses more rapidly over the next five years, but if you rely on the output from the prediction model you get the desired behavior. A t-test comparing the V2-V3 FEV1 change between rapid and slow groups is highly significant.
This is simple regression to the mean, but can still be counterintuitive. We had to look at the data a bit to really absorb the magnitude of this effect. I think one of the learning points here is that when FEV1 is observed only twice over relatively short time period, the delta FEV1 variable can be really noisy. When cutoffs are applied to a variable with low signal to noise ratio, the selected subjects at the extremes of the distribution also happen to be the ones with the largest measurement errors. Those subjects are not actually the ones with the greatest rate of “true progression,” they are just the ones with the largest measurement error that, by virtue of the thresholding, tend to all be aligned in the same direction. Then, if the measurement errors at visit 2 and visit 3 are independent, then the measured FEV1s of those subjects will move in the opposite direction at the next time point since those measurement errors will be evenly distributed around a mean of zero.

Published by