#2: Reproducibility: Disease axes > clusters, a 10 cohort validation study

In a 2017 collaboration among multiple American and European COPD research groups, we assessed the reproducibility of multiple clustering approaches and PCA in ten independent cohorts. This project remains one of my favorites, because the result was surprising and important. The published paper is fairly dense and complex, so the point here is to distill the essentials from that work. The primary goal of the project was to discover clusters that were replicable across all of our participating cohorts. For the clustering methods, we used the approaches described by Horvath and Langfelder, which are extensions of k-mediods and hierarchical clustering.

Since the choice of clustering parameters is often critical for the final results, we systematically varied k, minimum cluster size, and other more complex parameters for pruning the resulting hierarchical trees. This resulted in 23 clustering solutions within each of the 10 cohorts. The next challenge was how to compare these clustering results across studies. To do this, we built supervised prediction models in each dataset to predict the cluster membership for each of its 23 clustering results. These predictive models were then shared between the groups to “transfer” clusters from one cohort to another. This allowed for all of the 230 (23 solutions x 10 cohorts) clustering solutions to be compared within each cohort. The schematic of this workflow is shown below.

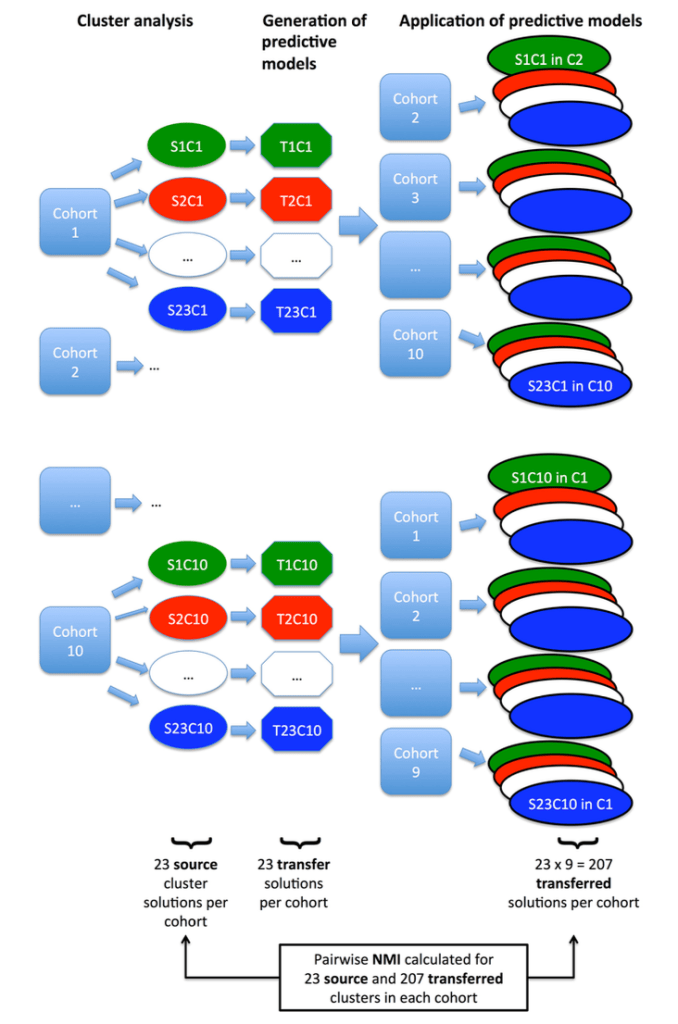
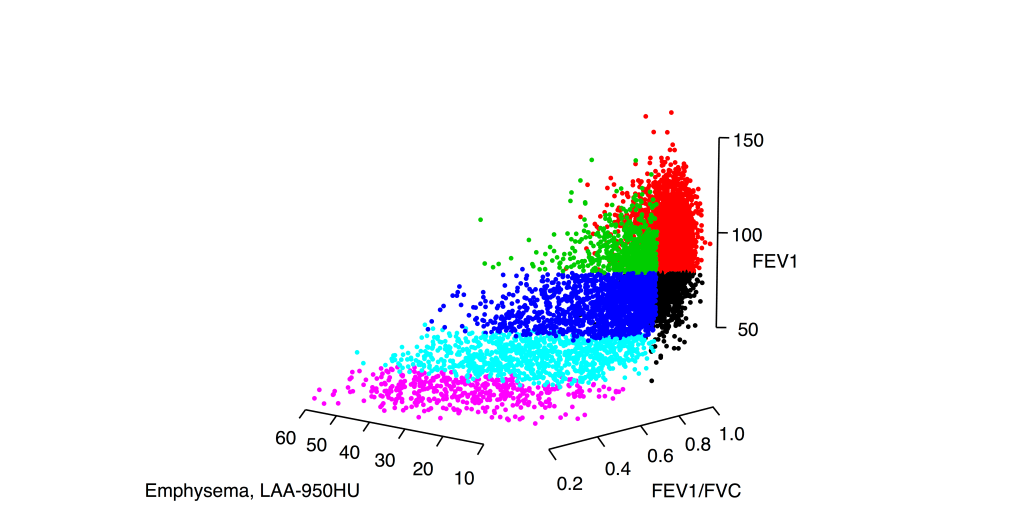
So what did we find when we compared these clustering results? A disappointingly low level of reproducibility. To give a specific example of what reproducibility means here, imagine that we generated two clustering results using the exact same methods, variables, and parameter settings in the two COPD cohorts, COPDGene and ECLIPSE. In each cohort then, we have an “original” clustering result, that looks like this.

In each cohort, we then build a predictive model to predict cluster membership. We trade models between groups, and we end up with the ECLIPSE clusters in COPDGene and vice versa. So now the cluster assignments look like this.

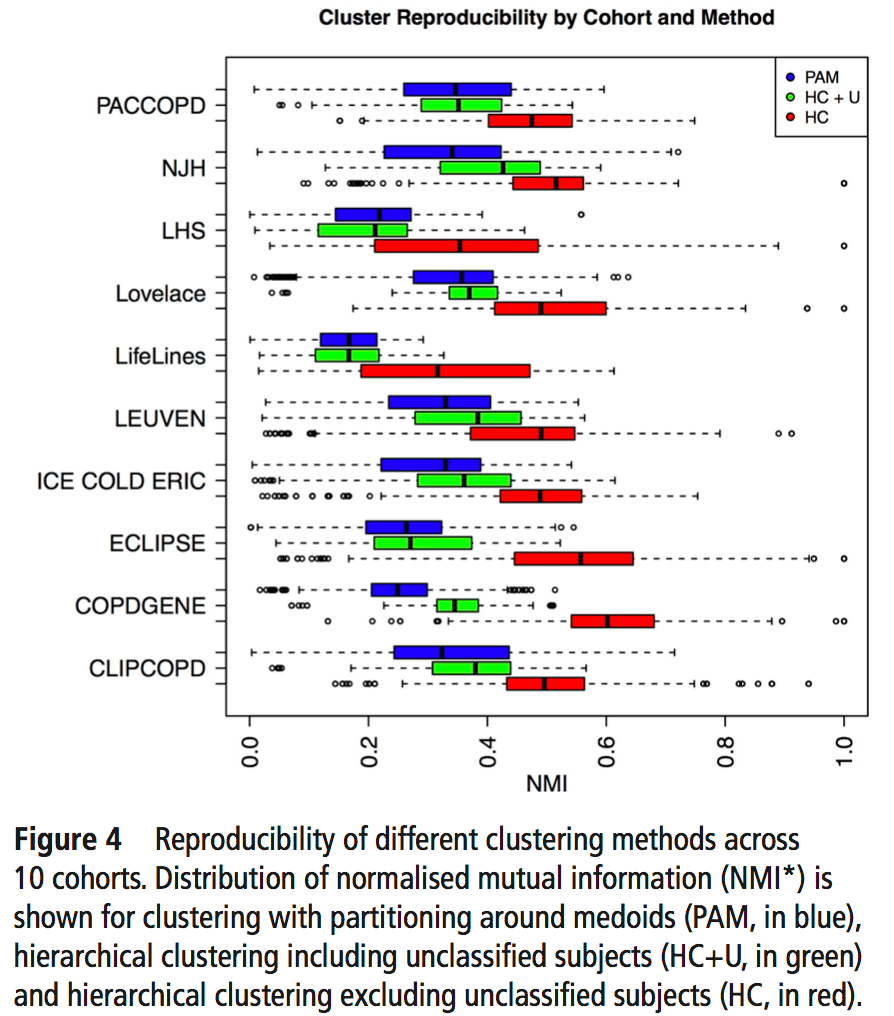
So, using the same subjects in each cohort, we can now look at the concordance between cluster assignments. If you consider things from the point of view of just one cohort, you now have the 23 original solutions from that cohort, as well as 23 x 9 = 207 transferred solutions from the 9 other cohorts. For each original solution, you could then compare it to its 9 exact matches from the other cohorts, or you could just compare it to every single transferred clustering solution to look for the best match. As our metric of similarity we used normalized mutual information (NMI), which gives a value of 1 for a perfect match and a value of 0 for completely independent solutions (some potential limitations of NMI are mentioned here). In our analysis we did the comparison both ways, and no matter how we looked at it the results were a bit disappointing. You can see the distribution of NMI values for each of the participating cohorts here.

To sum this up:

  • median NMI is almost always below 0.5. Not great agreement.
  • We divided clustering methods into groups, and the red group always has higher NMI values (groups described below).
  • Most cohorts have a handful of very reproducible solutions. But when we compared the high NMI solutions across all cohorts they were inconsistent (i.e. different number of clusters, no consistent high NMI performer across all cohorts).

The blue, green, and red bars indicate the three different general classes of clustering that were used. Blue = k-medioid clusters. Green and Red = hierarchical clustering. Importantly, on the red group of clustering solutions had the option of defining subjects as “unclusterable.” Thus, only the red methods have the option of saying, “I refuse to cluster some proportion of the subjects in this dataset.” For the details of these clustering methods you can refer to the brief paper by Langfelder and follow the citation trail as far as you want.

So if the clustering reproducibility isn’t great, the first three explanations that come to mind are as follows:

  • the algorithms stink (probably not the case since these have been shown to work with other kinds of data)
  • the cohorts are just very different from each other
  • the cohorts are similar, but there aren’t any clusters

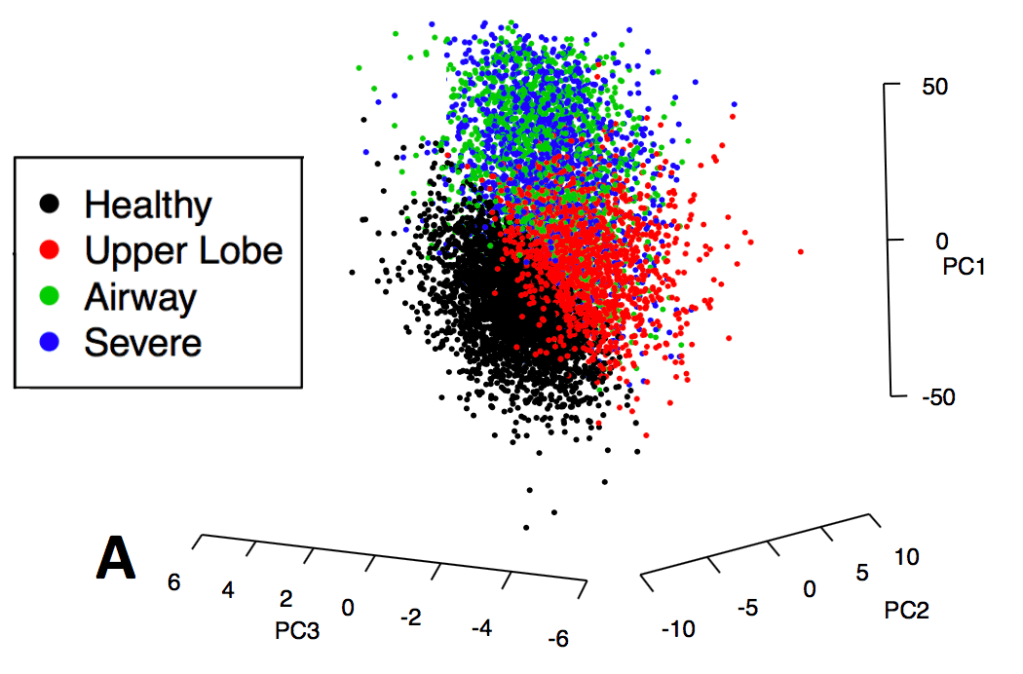
The correct answer seems to be the third one – the cohorts are actually fairly similar, but the process of defining clusters is what is not reproducible. The observation that supports this is that, when we calculated principal components from the same data used for clustering, the principal components were extremely similar. Here are the variable loadings for the first four PCs in each of the participating cohorts.

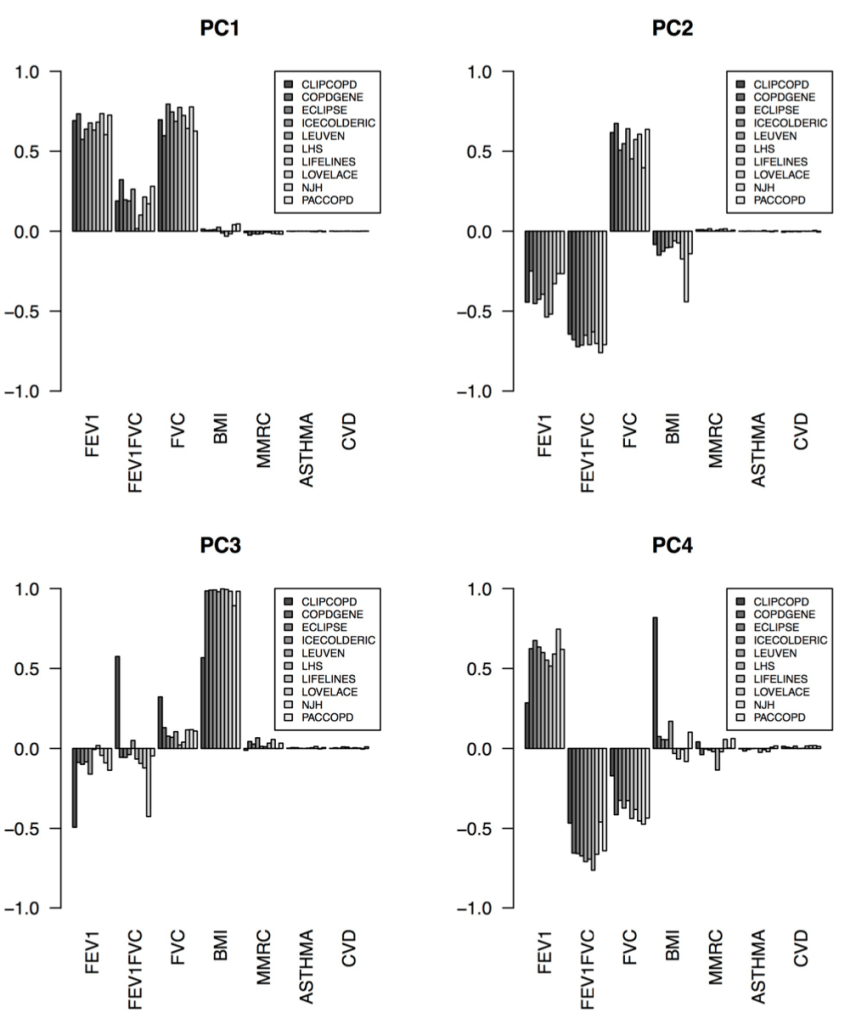
So, bad clusters, good PCs. The most natural conclusion is that the cohorts are in fact very similar, and more specifically the covariance structure of these variables is very consistent across cohorts. But the clustering partitions in these cohorts are not reproducible, probably because there is no “good” place to draw dividing lines in these data. The take home message is that we should probably focus first on PC-like continuous dimensions of variability (disease axes) rather than jumping immediately to clustering algorithms.

#1: The COPD continuum and the downsides of clustering

Most people believe that COPD isn’t just one disease. At the moment, COPD is an umbrella term that includes many different diseases and disease processes. There have also been many papers proposing various subtypes of COPD, but there is no agreement on what the specific subtypes of COPD actually are. Because there isn’t much consensus on how to summarize COPD heterogeneity, current COPD consensus definitions incporpoate COPD heterogeneity in only a limited manner.

The best attempt at synthesis of COPD subtypes is probably the paper by Pinto et al. which found that COPD studies using clustering methods were characterized by “significant heterogeneity in the selection of subjects, statistical methods used and outcomes validated” which made it impossible to compare results across studies or do a meta-analysis of COPD clustering. So, despite lots of attention and effort, progress in COPD subtyping has been slower than expected.

This post addresses two questions. First, “why can’t we agree on COPD subtypes?” Second, “How should we study COPD subtypes so as to produce more reliable results that people could agree on?” At a more general level, the issue is how to apply machine learning to make the best use of the current explosion of data available on large numbers of subjects with COPD. Large studies like COPDGene, SPIROMICS, and others have generated research grade clinical phenotyping, chest CT, and multiple kinds of genomic data that provide a whole new level of resolution into the molecular and lung structural changes that occur in COPD. It’s not unreasonable to think that these data would allow us to reclassify COPD in such a way that patterns of lung involvement combined with molecular signatures of disease processes would allow us to understand and predict the progression of different “flavors” of COPD with much greater accuracy. That is the goal, but getting there has proven more difficult than simply dropping all of these data into a machine learning black box and letting the magic happen.

Most subtyping projects assume that subtypes are distinct groups (as defined by some set of measured characteristics). This seems to make sense. After all, clinicians can easily describe patients with COPD whose clinical characteristics are so different as to suggest that they don’t really have the same disease at all, so why wouldn’t there be distinct groups? However, when we look at data from hundreds or thousands of people with COPD, it is abundantly clear that the distinct patients we can so easily recall don’t represent distinct groups but rather the ends of a continuous spectrum of disease. The image below shows why the COPD subtype concept is poorly suited for clinical reality of COPD.

10,000 smokers from the COPDGene Study

This is the distribution of smokers with and without COPD in a three dimensional space defined by FEV1, FEV1/FVC, and the percentage of emphysema on chest CT scan. Viewing these data in these three dimensions, it is clear that there are no clusters here. If you ask a clustering algorithm to draw partitions in data like this, many algorithms will happily give you clusters despite the fact that there is very little support in the data for distinct groups. Accordingly, these results will be:

  • highly sensitive to arbitrary choices of clustering method and parameters
  • not reproducible in independent data (as investigated here

To emphasize this point about low separability, here is the distribution in principal component space for COPDGene subjects colored by their k-means clusters as described in our 2014 paper in Thorax.

COPD k-means subtypes

Machine learning involves exploring lots of possible models rather than just a few. So if you’re going to be looking at lots of models, how will you choose a final model in a principled way? In our 2014 clustering paper we used a measure called normalized mutual information that measures the similarity between clustering results performed in the entire dataset compared to smaller subsamples of the data. The figure below shows how the distribution of NMI values across a range of feature sets and number of clusters (k).

The higher the NMI, the more reproducible the clustering result within our dataset. The variable set with the best internal reproducibility across the widest range of k was the simplest one that consisted of only four variables, but it is also clear that there is no single solution that stands out above the rest. If you want an NMI > 0.9, you have at least six clustering solutions to choose from. And they’re all quite different! The figure below shows how the clustering assignments shift as you go from 3 to 5 clusters.

COPD subtype reclassification by k
Emph Upper/Lower = emphysema apico-basal distribution
WA% = measure of airway wall thickness

Unfortunately, the choice between 3, 4, or 5 clusters is fairly arbitrary since their NMI values are very similar. So if this paper has been a huge success and transformed COPD care such that every person with COPD was assigned a Castaldi subtype, there are a lot of people who’s COPD subtype would depend on the very arbitrary choice between a final model with 3, 4, or 5 clusters. For example, there are 1,347 people (32%) who are belong to the airway-predominant COPD cluster (high airway wall thickness, low emphysema) in the k=3 solution, but only 778 (19%) in the k=5 solution. So what happened to those other 569 people? They’re bouncing around between subtypes based on fairly arbitrary analysis choices. We certainly don’t want COPD clinical subtypes to be determined based on this sort of arbitrary data analysis choice.

So why do I keep referring to COPD clusters as poorly reproducible despite the fact that the NMI values for our 2014 paper were very high? For three reasons. First, reproducibility subsamples of a single dataset is a lower bar than reproducibility across comparable independent datasets. Second, common sense suggests that algorithmically drawn separations in manifolds are likely to be driven by subtle differences that are dataset specific. Third, a systematic study of cluster reproducibility involving ten COPD cohorts from the US and Europe found only modest reproducibility of COPD clustering results.

So, is clustering useless? No, clustering in COPD is great for data exploration, which can be very enlightening and has demonstrably led to better understanding of COPD heterogeneity and novel molecular discoveries. But for the goal of producing reliable and rational clinical classification, traditional clustering methods are not well-equipped for summarizing COPD heterogeneity in a way that is likely to be highly reproducible. Other approaches are needed for that.