COPD subtypes: Table of Contents

Welcome to the COPD subtypes blog! This is the place to come for our most up-to-date thoughts about our approaches/findings regarding COPD subtypes. As of January 2020 we have five posts, which are summarized below. For those who want to start with a bigger picture summary, post #5 is the best place to start. Otherwise, if you go through them sequentially that more closely follows our published papers and the natural evolution of our groups’ thinking on subtypes.

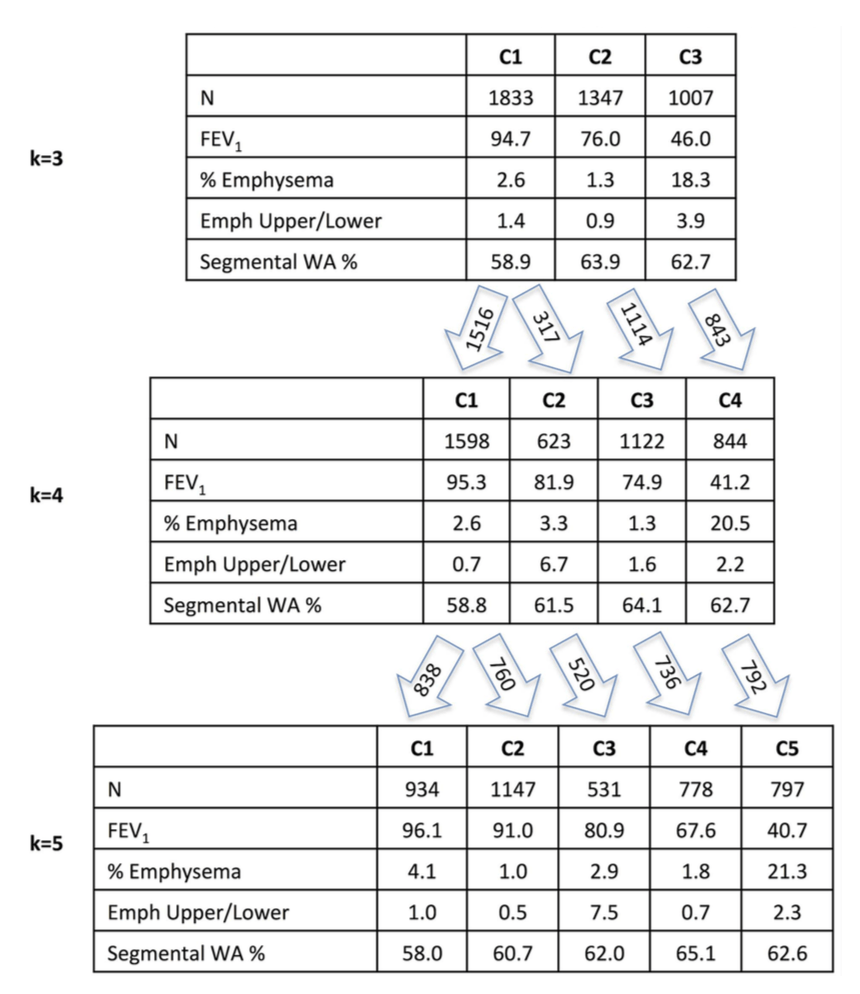
1: The COPD continuum and the downsides of clustering. Reviews one of our first subtyping papers and discusses the fact that COPD data usually do not have clear clustering structure.

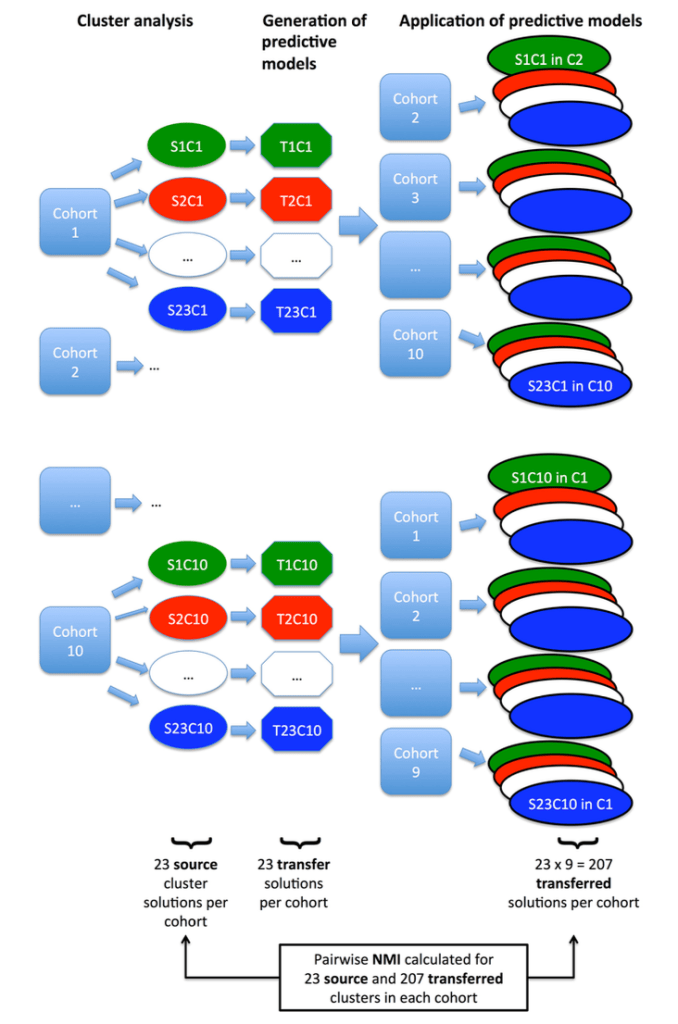
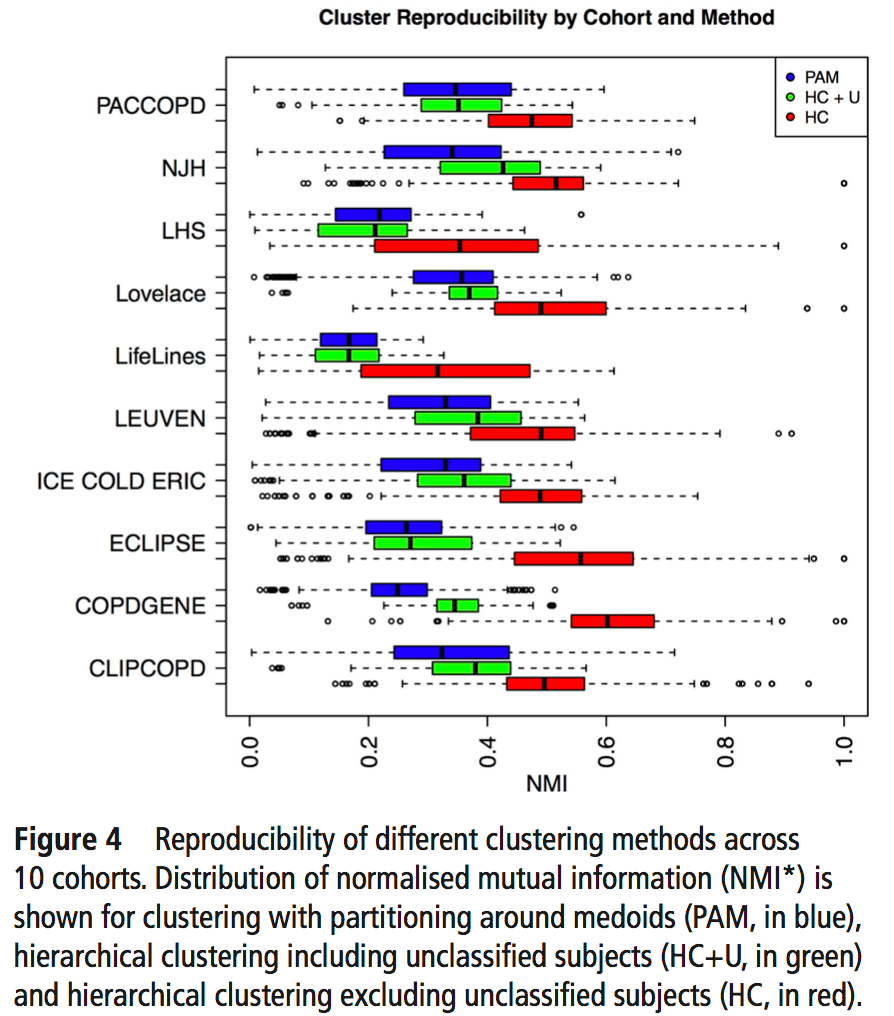
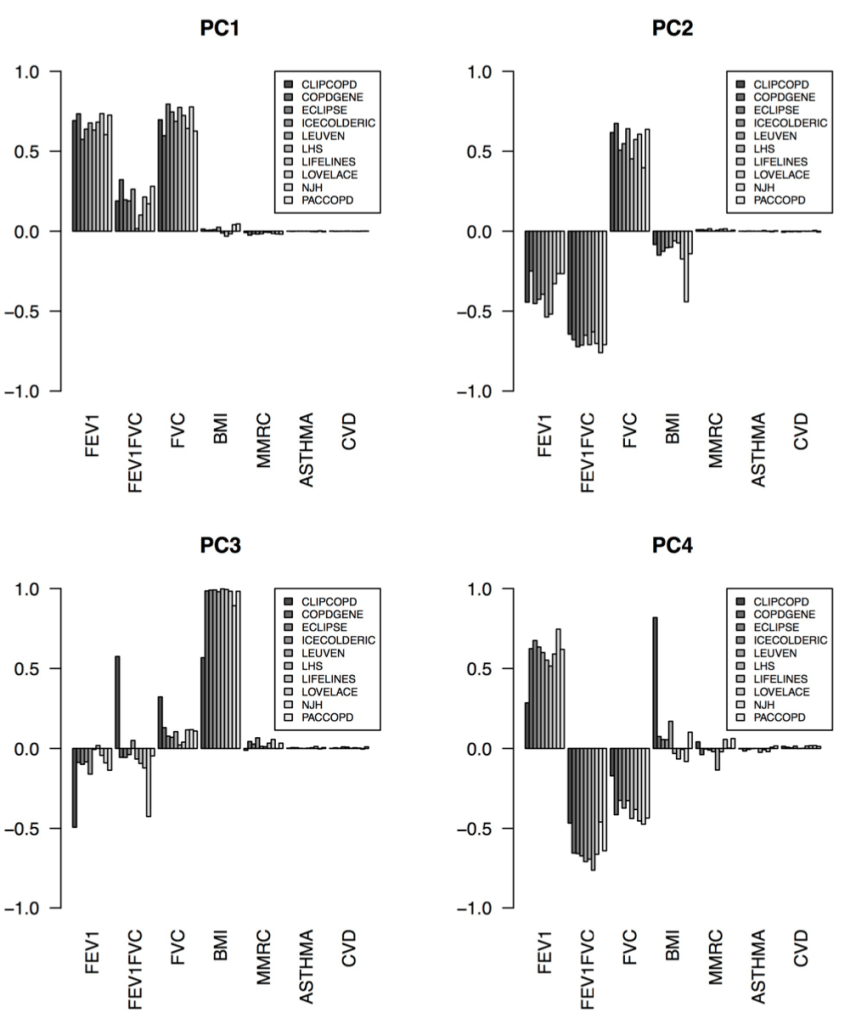
2: Reproducibility: Disease axes > clusters, a 10 cohort validation study. Reviews our collaborative paper that demonstrates 1) problems with clustering reproducibility in independent data and 2) high similarity of PCA axes across those same cohorts.

3: For COPD, think disease axes before clusters. A brief post that illustrates the importance of defining feature spaces (i.e. the variables that are most important for cluster identification) and introduces supervised learning and disease axes as a promising way to do this.

4: A clustering alternative: supervised prediction for disease axis discovery. Makes the case for an alternative path to clusters that goes first through supervised prediction and disease axes, then to outcome-driven subtypes.

5: What are COPD subtypes for? A higher level summary of how disease axes and supervised learning can be a useful approach.

#5: What are COPD subtypes for?

We often ask what the subtypes of COPD may be, but it’s less common to ask what we intend to do with the subtypes we want to discover. What are COPD subtypes for? Why do we need to discover them? There are usually two things that people want from a COPD subtype:

  • the subtype accurately captures an aspect of COPD biology
  • the subtype is correlated to an important clinical characteristic or outcome of COPD

An ideal subtype would give us both things at the same time, but I don’t think we’re there yet. There is still a gap between clearly “biological” subtypes and the best predictions we can get using supervised models. When we have subtypes that are clearly “biological” that are also essential for accurate prediction of important COPD outcomes, then perhaps we will have attained something like an updated, biologically-driven COPD classification. It’s clear that we should think of the search for COPD subtypes as a long-term project. Since subtypes can mean different things to different people, trying to solve all of our subtyping needs in one step may not be the most productive approach.

To put things a bit more bluntly, there is a kind of machine learning analysis cycle that usually leads to disappointment, and that I think we should try to avoid. It goes like this:

  • Step 1 (This is going to be great) : We have lots of great data, and we’re going to do machine learning!
  • Step 2 (Unbiased machine learning is great) : We’re going to be unbiased, so we’re going to define some variables/outcomes that we want our subtypes to be associated to, and we’re going to hold these out of the machine learning process to validate what we find.
  • Step 3 (Why isn’t this working) : We did machine learning and found stuff, but that stuff isn’t as strongly associated to our validation measures as we hoped.
  • Step 4 (The unacknowledged descent into supervised learning) : Let’s try to modify our set of input variables and tweak our parameters so that our “validation” metrics look better.
  • Step 5 (The results desert) : We’ve done a lot of things, but we haven’t found a great solution, and we don’t have a good rationale for picking which one of our many clustering results should be the main one (as described in detail in this post).
  • Step 6 (Strategic retreat) : These results aren’t what we’ve hoped, but let’s make some ad-hoc justifications and write this up.

Sound familiar? I’ve been there many times, and it can be frustrating. But it’s important to be honest about the challenges of unsupervised clustering in COPD with the intent of finding the best possible way forward. I think it helps to acknowledge the following things.

We’re a long way from the dream of true, biologically correct COPD subtypes. COPD is complex and difficult to study. We don’t fully understand the natural history and causative factors of COPD, and dividing COPD into its biological subtypes implies a level of understanding that doesn’t yet exist. Paradoxically, we won’t really understand COPD biology and natural history without accounting for its subtypes. So, we need to pull ourselves up by our bootstraps so to speak and iterate between subtype definition and biological discovery.

We should use supervised learning methods rather than focusing exclusively on unsupervised clustering. The ability of supervised models to help identify (or construct) important features can really help us in the first stage of data exploration. Too often, unsupervised clustering yields multiple possible solutions with only modest associations to COPD outcomes and weak justification for choosing a single, “optimal” solution. Supervised methods are much better equipped to discriminate between models and reduce data dimensionality in a way that is relevant to COPD-related outcomes, as discussed here. Using “all the data” in an unbiased manner will not, in and of itself, be sufficient.

Integrating prior knowledge into machine learning studies is essential, and this is for two reasons. First, when machine learning methods are applied to biological problems, we care not only about the accuracy but the interpretability of the model. “Interpretability” in this case means comparing the structure of our models to already known biology (think of gene set enrichment analysis as a crude example of this). Second, even though biology is now a data science, we still don’t have the volume of data required to learn all the necessary parameters for most models by “brute force” (see an excellent review here). The best applications of machine learning to biology typically use biological knowledge to guide parameter selection or model structure. For COPD and other chronic diseases, we need to be prepared to assist our algorithms by “hard-coding” biological knowledge into our models (as here, for example).

We need to be more specific about what we mean by subtype. With respect to subtypes, do we think there a single set of subtypes that capture the essential differences between people with COPD? Maybe. But think about it this way – is there a single set of lung cancer subtypes that capture the important differences between subjects with lung cancer? It’s complicated. Pathology matters – there are important differences between adenocarcinoma and small cell cancers. But molecular markers also matter, especially in light of available treatments. EGFR mutation and expression patterns matter, but so does ALK1, RET, and other genes. Do these markers define subtypes because they are more biologically important than other genes, or is this driven primarily by the fact that we have effective treatments targeting these genes? We want our subtypes to be biologically relevant, clinically useful, and we want machine learning to find this all for us in an “unbiased” manner. But if we’re not careful we end up asking machine learning methods to ask questions that really can’t be answered, at least not with the data we have provided. This is a reason for focusing on outcome-specific subtypes (rather than one-size-fits all subtypes) as an interim measure.

Where this will ultimately end for COPD? We are still in the relatively early stages of learning how to best utilize big datasets of images and genomics. While it seems clear that supervised approaches have promise, it is also true unbiased genomics screens have advanced our biological knowledge significantly. From genome-wide association studies, we now know more than 80 genetic loci that contribute to COPD risk. Detailed functional analysis of individual loci has led to novel functional insights that implicate specific genes, regulatory elements, and cell types, as has been shown for genetic influences on TGFB2 expression in lung fibroblasts. These rich datasets have already produced new biological insights. But we are also now in the post-GWAS era where the challenge is not only to discover disease-associated molecules but also to put them in context and better define their utility and applicability. For these second-order projects, of which subtyping is an example, some degree of supervision will probably lead to more fruitful applications of machine learning.

#4: A clustering alternative: supervised prediction for disease axis discovery

COPD clustering papers often justify the importance of their clusters by demonstrating their association to a meaningful clinical outcome, such as the frequency of respiratory exacerbations or rate of disease progression. In previous posts, the point has been made that the COPD “phenotypic space” is usually a continuum and that continuous “disease axes” provide a more accurate and reproducible summarization of this continuum than clusters. This post describes one possible response to the challenge of poor cluster reproducibility by identifying disease axes through supervised learning. At the end, a way back to subtypes is explored.

First, if the goal is to be able to make better predictions of future COPD outcomes, it’s clear that for disease axes generally outperform clusters, often by a substantial margin. In a paper from 2018, Greg Kinney and colleagues at National Jewish Health used factor analysis to identify four main factors of variability in COPDGene data, including measures from chest CT, spirometry, and functional assessments. Focusing on overall mortality, each of the four factors was significantly associated to mortality, and there was synergistic effect of factors related to emphysema and airways disease on mortality risk, as shown below.

The mortality analysis from Kinney’s paper encourages us to think about defining subtype boundaries based on the distribution of outcome risk is relation to disease axes. Unlike clustering, which defines groups based on similarity in the original clustering space, this approach defines a relevant feature space (defined by disease axes) but then establishes group boundaries based on the local probability of a given outcome. As this paper shows, in the space defined by emphysema and airways disease, the relationship to mortality is non-linear. It would be natural to divide subjects into two groups along the boundary where mortality risk begins to increase sharply. One benefit of this outcome-driven approach to defining subtypes is that it can easily be adapted to other relevant outcomes, for example treatment response.

But what about a head-to-head comparison of outcome prediction for subtypes versus disease axes? In a 2019 paper in Thorax, we used prediction models to generate subtype-oriented disease axes (SODAs). Unlike disease axis from factor analysis or PCA, the use of supervised learning to generate SODAs allows the user more explicit control over what their disease axes mean/represent. In factor analysis and PCA, the orientation of a disease axis is determined by the correlation structure of the original data. While this is often desirable, it means that axes are determined by the initial selection of variables. SODAs on the other hand are determined by:

  • the response variable, which in this case is a binary variable encoding two subgroups of subjects (i.e. subtypes)
  • input or predictor variables

To make a SODA, we build a predictive model using the two subtype groups (i.e. subtypes) as a binary response and the input variables as predictors. For example, if you specify a group of “pure airways disease” subjects and another group of “emphysema predominant subjects”, then the resulting SODA axis can be thought of as a line with airways disease at one end and emphysema at the other. Importantly, the SODA model can be built with a subset of subjects and then applied to the entire dataset.

Using that method, you can generate SODAs and compare them directly to their “parent” subtypes. In 4,726 subjects from COPDGene with 5-year followup data we generated 6 SODAs from 6 subtype pairs, and we compared the predictive performance of the SODAs to their corresponding subtypes with respect to five-year prospective change in FEV1 and CT emphysema. As shown in the table below, SODAs consistently explained more variance in COPD progression than subtypes. If you put SODAs and subtypes in the same models (Table 2 from the paper), the SODAs were nearly always significant (9 out of 12 models) whereas the subtypes were not (4 out of 12).

If one focuses only on the subtype of chronic bronchitis (per the ATS-DLD definition), the bronchitis SODA explains nearly twice as much of the 5-year change in emphysema as the original variable. Why is this? First of all, let’s look at how the chronic bronchitis SODA is distributed according to chronic bronchitis status at baseline and at the follow-up visit.

It is evident that the values of the SODA are shifted as one would expect. Subjects with persistent chronic bronchitis (the P-CB group, i.e. chronic bronchitis at baseline and at five-year followup) have higher SODA values than those without chronic bronchitis (the left group) or those with bronchitis at only one visit (the two middle groups). Importantly, the SODA models were built using information only from the baseline visit.

It’s also fun to look at loess curves of the relationship between the bronchitis SODA and prospective five year changes in FEV1 and emphysema. You can see why the emphysema prediction is particularly strong.

So, how is it that a SODA that is trained by a subtype can actually predict better than the subtype itself? The biggest reason is that the SODA models have access to a lot of information beyond the subtype assignment, namely through their access to the predictor variables. The regression model can be thought of as a filter for the predictor variables. It sorts through the predictors, keeping only those aspects of the variability that are relevant to the subtype. In the case of the chronic bronchitis SODA, it includes not just chronic bronchitis information, but other relevant aspects of FEV1, CT emphysema, and airway hyperresponsiveness. It turns out that, in addition to being relevant to chronic bronchitis, this information is also relevant to future emphysema progression.

So perhaps I’ve convinced you that disease axes are great and the way to go, at least in certain cases. But sometimes you just need subgroups, not axes. For these situations, there is a way to get back to subgroups, and that way is probably more principled and reproducible than clustering. To extend our earlier idea about defining subgroups according to the distribution of outcome risk within a relevant feature space, we can do this for the bronchitis SODA using classification trees, for example. The image below shows subgroups defined solely by cutpoints in the bronchitis SODA, where cutpoint locations were determined by maximizing the difference in CT emphysema progression between groups. The box and whisker plots below show the distribution of change in Perc15 values for each of the bronchitis SODA subgroups. (This analysis was done at an earlier time when there were fewer COPDGene subjects with available follow-up data, hence the smaller numbers.)

To sum up, this post describes an alternative to clustering that relies heavily on supervised learning to define disaease axes, but it can bring you back to subgroups if you wish, and those subgroups are more likely to be relevant for a given outcome than unsupervised clusters. If we are concerned primarily about the association of our subtypes to some important COPD measure (and we usually are), then it makes sense to incorporate supervised learning early in the subtype identification process to define relevant feature spaces for subsequent cluster/subtype identification.

#3: For COPD, think disease axes before clusters

Two previous posts illustrate that COPD clinical data usually forms a continuum without clusters with the resulting effect that COPD clustering is often poorly reproducible. So why are there still so many clustering papers? I think this is because we now have much more complex COPD datasets than we used to, and if you wish to use these data to find novel COPD subtypes, clustering is a natural first step. However, the reproducibility challenges cannot be ignored, so there is a need to find alternative applications of machine learning to help is find reproducible and clinically-relevant patterns in our rich datasets.

When defining COPD subtypes, one of the first challenges is to identify the proper feature space in which subtypes should be defined/discovered. For most data sets, we’re usually not interested in all of the variables, but only in some subset that are relevant to what we’re interested in. But picking that subset is more art than science, so it’s worth spending some time to illustrate this fairly obvious but often under-emphasized aspect of clustering. It’s easiest to visualize spaces in three dimensions, so let’s stick with that for COPD and explore two different COPD feature spaces. The first one is defined by FEV1, FEV1/FVC, and CT emphysema. For contrast, let’s view that space side by side with a space defined by emphysema, airway wall thickness, and the number of exacerbations in the previous year. These data are from ~5,000 subjects in the COPDGene Study second study visit.

While the spaces share one variable (% of emphysema on CT), the overall distribution of these data points is quite different, as you can see by the loss of order of the GOLD stages in the figure on the right. Both spaces seem to have a fairly continuous distribution of points within what seems to be a roughly conical or triangular shape, and neither space has distinct clusters. Clustering performed on these two spaces would produce very different results for the same subjects, highlighting the importance of choosing the feature space. While clustering is often touted as unbiased data analysis, that description minimizes the critical role played by the selection of user-defined parameters (such as the selection of variables) in determining the final result. At its worst, this use of the term “unbiased” ends up being an empty buzzword that gestures towards the magical ability of machine learning to yield insights from big data. In reality, useful machine learning analyses often rely heavily on human expertise and intuition. When we just let the data “speak for itself”, it often turns out that either no one can understand what the data are saying or the data tell us something we don’t want to hear.

In the case of COPD clustering, the data nearly always tell us quite clearly that, first and foremost, there aren’t any distinct clusters. We have also shown how the selection of the feature space for clustering is usually a biased choice made by people rather than algorithms. In this case, bias isn’t necessarily bad, it just refers to the fact that an informed person knows things about their data that algorithms do not.

So, rather than naively apply clustering, what should we do? It’s often useful to perform dimension reduction as first step in analyzing a rich data set to identify dominant trends in the data and focus on understanding those (as done here). Dimension reduction preserves the continuous nature of how COPD data are dispersed in relevant feature spaces, and as a result it provides a more accurate summarization of the data. The most commonly used form of dimension reduction is principal component analysis (PCA), which combines variables together in a linear manner (i.e. variables are added together not multiplied) to produce composite variables that can be considered to define key axes of variability. These key axes, or disease axes, are a more accurate way to start making sense of complex data and to define feature spaces for further investigations of COPD heterogeneity.

To sum up, disease axes are more consistent with the underlying continuous nature of COPD data, which is why they are a better first step for analyzing complex COPD data than clustering. Of course, one down side to disease axes is that, with common methods like PCA, users have little control over the precise aspects of variability that end up being captured by PCA. To address that issue, we have shown how how supervised prediction methods can be a tool for identifying disease axes that have a very clear and specific meaning. As a bonus, these disease axes often provide more accurate prediction of future COPD events than subtype do.

#2: Reproducibility: Disease axes > clusters, a 10 cohort validation study

In a 2017 collaboration among multiple American and European COPD research groups, we assessed the reproducibility of multiple clustering approaches and PCA in ten independent cohorts. This project remains one of my favorites, because the result was surprising and important. The published paper is fairly dense and complex, so the point here is to distill the essentials from that work. The primary goal of the project was to discover clusters that were replicable across all of our participating cohorts. For the clustering methods, we used the approaches described by Horvath and Langfelder, which are extensions of k-mediods and hierarchical clustering.

Since the choice of clustering parameters is often critical for the final results, we systematically varied k, minimum cluster size, and other more complex parameters for pruning the resulting hierarchical trees. This resulted in 23 clustering solutions within each of the 10 cohorts. The next challenge was how to compare these clustering results across studies. To do this, we built supervised prediction models in each dataset to predict the cluster membership for each of its 23 clustering results. These predictive models were then shared between the groups to “transfer” clusters from one cohort to another. This allowed for all of the 230 (23 solutions x 10 cohorts) clustering solutions to be compared within each cohort. The schematic of this workflow is shown below.

So what did we find when we compared these clustering results? A disappointingly low level of reproducibility. To give a specific example of what reproducibility means here, imagine that we generated two clustering results using the exact same methods, variables, and parameter settings in the two COPD cohorts, COPDGene and ECLIPSE. In each cohort then, we have an “original” clustering result, that looks like this.

In each cohort, we then build a predictive model to predict cluster membership. We trade models between groups, and we end up with the ECLIPSE clusters in COPDGene and vice versa. So now the cluster assignments look like this.

So, using the same subjects in each cohort, we can now look at the concordance between cluster assignments. If you consider things from the point of view of just one cohort, you now have the 23 original solutions from that cohort, as well as 23 x 9 = 207 transferred solutions from the 9 other cohorts. For each original solution, you could then compare it to its 9 exact matches from the other cohorts, or you could just compare it to every single transferred clustering solution to look for the best match. As our metric of similarity we used normalized mutual information (NMI), which gives a value of 1 for a perfect match and a value of 0 for completely independent solutions (some potential limitations of NMI are mentioned here). In our analysis we did the comparison both ways, and no matter how we looked at it the results were a bit disappointing. You can see the distribution of NMI values for each of the participating cohorts here.

To sum this up:

  • median NMI is almost always below 0.5. Not great agreement.
  • We divided clustering methods into groups, and the red group always has higher NMI values (groups described below).
  • Most cohorts have a handful of very reproducible solutions. But when we compared the high NMI solutions across all cohorts they were inconsistent (i.e. different number of clusters, no consistent high NMI performer across all cohorts).

The blue, green, and red bars indicate the three different general classes of clustering that were used. Blue = k-medioid clusters. Green and Red = hierarchical clustering. Importantly, on the red group of clustering solutions had the option of defining subjects as “unclusterable.” Thus, only the red methods have the option of saying, “I refuse to cluster some proportion of the subjects in this dataset.” For the details of these clustering methods you can refer to the brief paper by Langfelder and follow the citation trail as far as you want.

So if the clustering reproducibility isn’t great, the first three explanations that come to mind are as follows:

  • the algorithms stink (probably not the case since these have been shown to work with other kinds of data)
  • the cohorts are just very different from each other
  • the cohorts are similar, but there aren’t any clusters

The correct answer seems to be the third one – the cohorts are actually fairly similar, but the process of defining clusters is what is not reproducible. The observation that supports this is that, when we calculated principal components from the same data used for clustering, the principal components were extremely similar. Here are the variable loadings for the first four PCs in each of the participating cohorts.

So, bad clusters, good PCs. The most natural conclusion is that the cohorts are in fact very similar, and more specifically the covariance structure of these variables is very consistent across cohorts. But the clustering partitions in these cohorts are not reproducible, probably because there is no “good” place to draw dividing lines in these data. The take home message is that we should probably focus first on PC-like continuous dimensions of variability (disease axes) rather than jumping immediately to clustering algorithms.

#1: The COPD continuum and the downsides of clustering

Most people believe that COPD isn’t just one disease. At the moment, COPD is an umbrella term that includes many different diseases and disease processes. There have also been many papers proposing various subtypes of COPD, but there is no agreement on what the specific subtypes of COPD actually are. Because there isn’t much consensus on how to summarize COPD heterogeneity, current COPD consensus definitions incporpoate COPD heterogeneity in only a limited manner.

The best attempt at synthesis of COPD subtypes is probably the paper by Pinto et al. which found that COPD studies using clustering methods were characterized by “significant heterogeneity in the selection of subjects, statistical methods used and outcomes validated” which made it impossible to compare results across studies or do a meta-analysis of COPD clustering. So, despite lots of attention and effort, progress in COPD subtyping has been slower than expected.

This post addresses two questions. First, “why can’t we agree on COPD subtypes?” Second, “How should we study COPD subtypes so as to produce more reliable results that people could agree on?” At a more general level, the issue is how to apply machine learning to make the best use of the current explosion of data available on large numbers of subjects with COPD. Large studies like COPDGene, SPIROMICS, and others have generated research grade clinical phenotyping, chest CT, and multiple kinds of genomic data that provide a whole new level of resolution into the molecular and lung structural changes that occur in COPD. It’s not unreasonable to think that these data would allow us to reclassify COPD in such a way that patterns of lung involvement combined with molecular signatures of disease processes would allow us to understand and predict the progression of different “flavors” of COPD with much greater accuracy. That is the goal, but getting there has proven more difficult than simply dropping all of these data into a machine learning black box and letting the magic happen.

Most subtyping projects assume that subtypes are distinct groups (as defined by some set of measured characteristics). This seems to make sense. After all, clinicians can easily describe patients with COPD whose clinical characteristics are so different as to suggest that they don’t really have the same disease at all, so why wouldn’t there be distinct groups? However, when we look at data from hundreds or thousands of people with COPD, it is abundantly clear that the distinct patients we can so easily recall don’t represent distinct groups but rather the ends of a continuous spectrum of disease. The image below shows why the COPD subtype concept is poorly suited for clinical reality of COPD.

10,000 smokers from the COPDGene Study

This is the distribution of smokers with and without COPD in a three dimensional space defined by FEV1, FEV1/FVC, and the percentage of emphysema on chest CT scan. Viewing these data in these three dimensions, it is clear that there are no clusters here. If you ask a clustering algorithm to draw partitions in data like this, many algorithms will happily give you clusters despite the fact that there is very little support in the data for distinct groups. Accordingly, these results will be:

  • highly sensitive to arbitrary choices of clustering method and parameters
  • not reproducible in independent data (as investigated here

To emphasize this point about low separability, here is the distribution in principal component space for COPDGene subjects colored by their k-means clusters as described in our 2014 paper in Thorax.

COPD k-means subtypes

Machine learning involves exploring lots of possible models rather than just a few. So if you’re going to be looking at lots of models, how will you choose a final model in a principled way? In our 2014 clustering paper we used a measure called normalized mutual information that measures the similarity between clustering results performed in the entire dataset compared to smaller subsamples of the data. The figure below shows how the distribution of NMI values across a range of feature sets and number of clusters (k).

The higher the NMI, the more reproducible the clustering result within our dataset. The variable set with the best internal reproducibility across the widest range of k was the simplest one that consisted of only four variables, but it is also clear that there is no single solution that stands out above the rest. If you want an NMI > 0.9, you have at least six clustering solutions to choose from. And they’re all quite different! The figure below shows how the clustering assignments shift as you go from 3 to 5 clusters.

COPD subtype reclassification by k
Emph Upper/Lower = emphysema apico-basal distribution
WA% = measure of airway wall thickness

Unfortunately, the choice between 3, 4, or 5 clusters is fairly arbitrary since their NMI values are very similar. So if this paper has been a huge success and transformed COPD care such that every person with COPD was assigned a Castaldi subtype, there are a lot of people who’s COPD subtype would depend on the very arbitrary choice between a final model with 3, 4, or 5 clusters. For example, there are 1,347 people (32%) who are belong to the airway-predominant COPD cluster (high airway wall thickness, low emphysema) in the k=3 solution, but only 778 (19%) in the k=5 solution. So what happened to those other 569 people? They’re bouncing around between subtypes based on fairly arbitrary analysis choices. We certainly don’t want COPD clinical subtypes to be determined based on this sort of arbitrary data analysis choice.

So why do I keep referring to COPD clusters as poorly reproducible despite the fact that the NMI values for our 2014 paper were very high? For three reasons. First, reproducibility subsamples of a single dataset is a lower bar than reproducibility across comparable independent datasets. Second, common sense suggests that algorithmically drawn separations in manifolds are likely to be driven by subtle differences that are dataset specific. Third, a systematic study of cluster reproducibility involving ten COPD cohorts from the US and Europe found only modest reproducibility of COPD clustering results.

So, is clustering useless? No, clustering in COPD is great for data exploration, which can be very enlightening and has demonstrably led to better understanding of COPD heterogeneity and novel molecular discoveries. But for the goal of producing reliable and rational clinical classification, traditional clustering methods are not well-equipped for summarizing COPD heterogeneity in a way that is likely to be highly reproducible. Other approaches are needed for that.