Two previous posts illustrate that COPD clinical data usually forms a continuum without clusters with the resulting effect that COPD clustering is often poorly reproducible. So why are there still so many clustering papers? I think this is because we now have much more complex COPD datasets than we used to, and if you wish to use these data to find novel COPD subtypes, clustering is a natural first step. However, the reproducibility challenges cannot be ignored, so there is a need to find alternative applications of machine learning to help is find reproducible and clinically-relevant patterns in our rich datasets.
When defining COPD subtypes, one of the first challenges is to identify the proper feature space in which subtypes should be defined/discovered. For most data sets, we’re usually not interested in all of the variables, but only in some subset that are relevant to what we’re interested in. But picking that subset is more art than science, so it’s worth spending some time to illustrate this fairly obvious but often under-emphasized aspect of clustering. It’s easiest to visualize spaces in three dimensions, so let’s stick with that for COPD and explore two different COPD feature spaces. The first one is defined by FEV1, FEV1/FVC, and CT emphysema. For contrast, let’s view that space side by side with a space defined by emphysema, airway wall thickness, and the number of exacerbations in the previous year. These data are from ~5,000 subjects in the COPDGene Study second study visit.
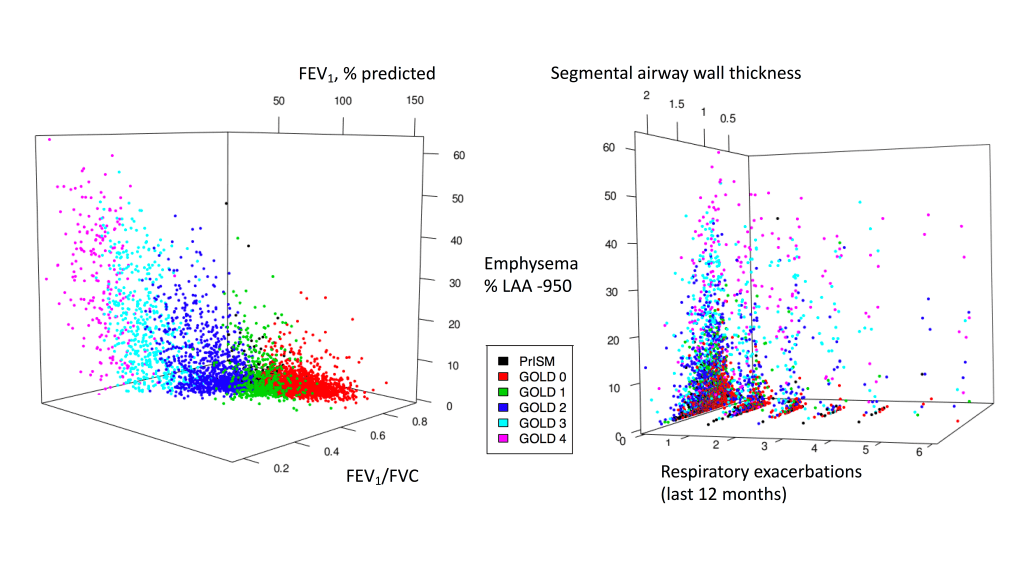
While the spaces share one variable (% of emphysema on CT), the overall distribution of these data points is quite different, as you can see by the loss of order of the GOLD stages in the figure on the right. Both spaces seem to have a fairly continuous distribution of points within what seems to be a roughly conical or triangular shape, and neither space has distinct clusters. Clustering performed on these two spaces would produce very different results for the same subjects, highlighting the importance of choosing the feature space. While clustering is often touted as unbiased data analysis, that description minimizes the critical role played by the selection of user-defined parameters (such as the selection of variables) in determining the final result. At its worst, this use of the term “unbiased” ends up being an empty buzzword that gestures towards the magical ability of machine learning to yield insights from big data. In reality, useful machine learning analyses often rely heavily on human expertise and intuition. When we just let the data “speak for itself”, it often turns out that either no one can understand what the data are saying or the data tell us something we don’t want to hear.
In the case of COPD clustering, the data nearly always tell us quite clearly that, first and foremost, there aren’t any distinct clusters. We have also shown how the selection of the feature space for clustering is usually a biased choice made by people rather than algorithms. In this case, bias isn’t necessarily bad, it just refers to the fact that an informed person knows things about their data that algorithms do not.
So, rather than naively apply clustering, what should we do? It’s often useful to perform dimension reduction as first step in analyzing a rich data set to identify dominant trends in the data and focus on understanding those (as done here). Dimension reduction preserves the continuous nature of how COPD data are dispersed in relevant feature spaces, and as a result it provides a more accurate summarization of the data. The most commonly used form of dimension reduction is principal component analysis (PCA), which combines variables together in a linear manner (i.e. variables are added together not multiplied) to produce composite variables that can be considered to define key axes of variability. These key axes, or disease axes, are a more accurate way to start making sense of complex data and to define feature spaces for further investigations of COPD heterogeneity.
To sum up, disease axes are more consistent with the underlying continuous nature of COPD data, which is why they are a better first step for analyzing complex COPD data than clustering. Of course, one down side to disease axes is that, with common methods like PCA, users have little control over the precise aspects of variability that end up being captured by PCA. To address that issue, we have shown how how supervised prediction methods can be a tool for identifying disease axes that have a very clear and specific meaning. As a bonus, these disease axes often provide more accurate prediction of future COPD events than subtype do.

[…] 3: For COPD, think disease axes before clusters. A brief post that illustrates the importance of defining feature spaces (i.e. the variables that are most important for cluster identification) and introduces supervised learning and disease axes as a promising way to do this. […]
LikeLike